Add 3 months moving average in Excel

To do it in Excel, here is the answer:

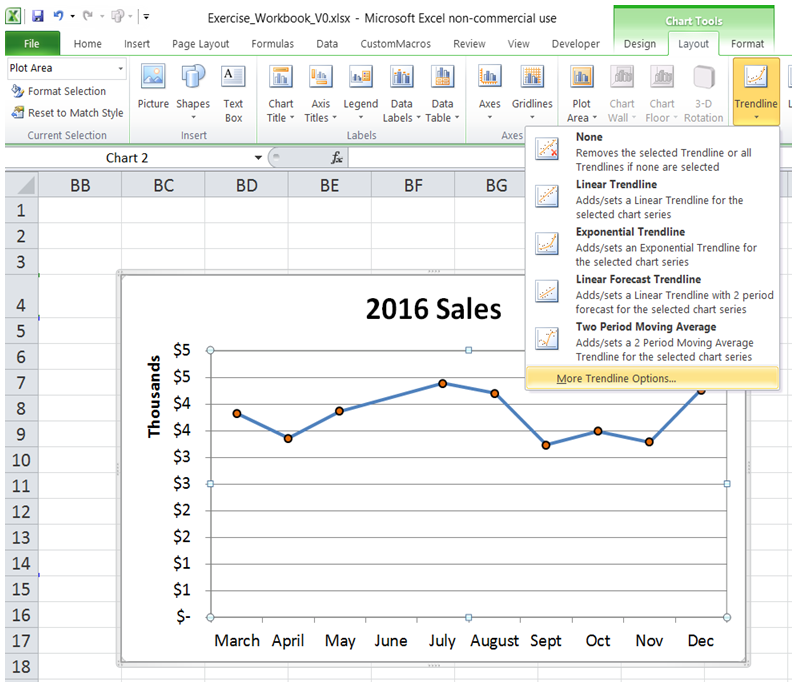
a) Click on Chart. "Chart Tools" tab appears in ribbon. Under "Chart Tools", Click on Layout -> Trendline -> More Trendline Options as shown below.

excel add 3 months moving average

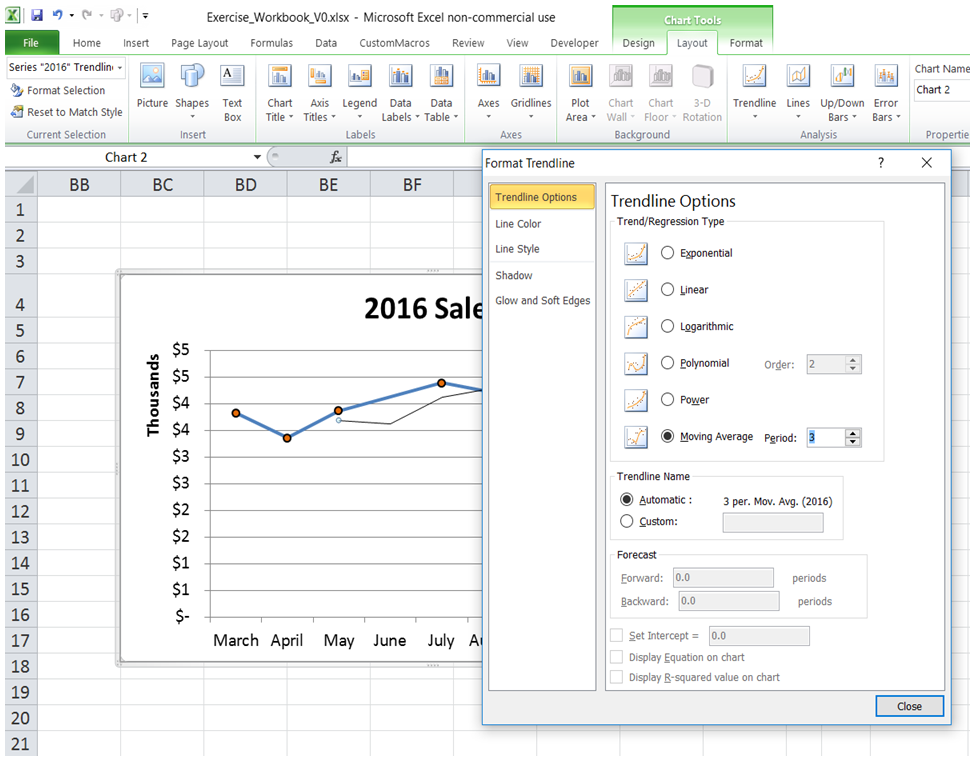
b) Select "Moving Average". Set the Period as 3.

excel add 3 months moving average

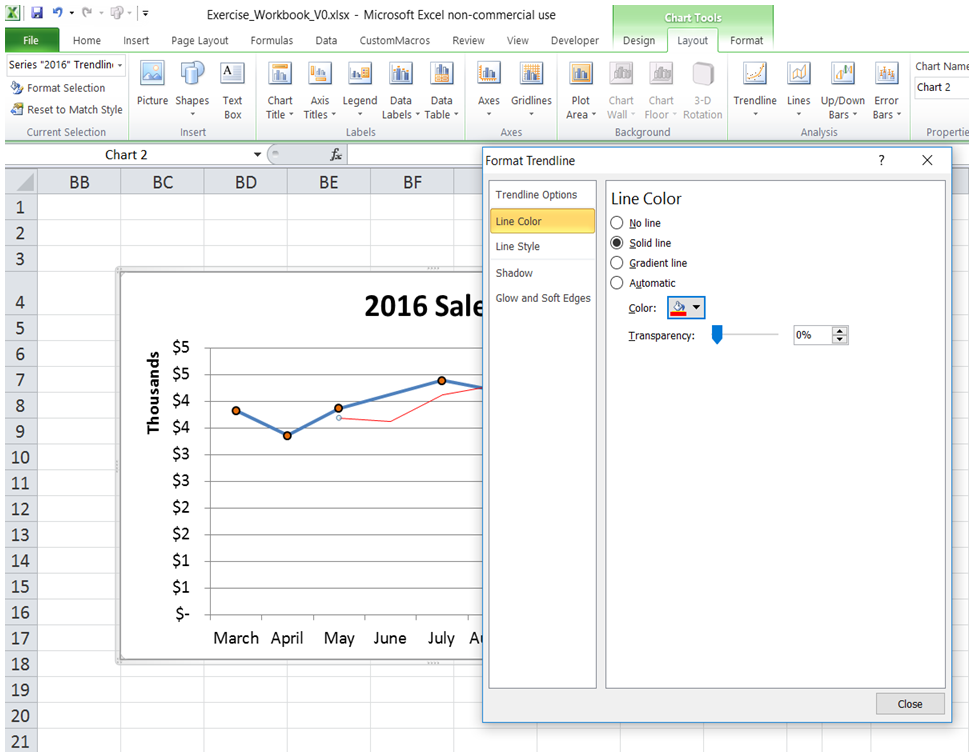
c) Click on Line Color. Select a color of choice.

excel add 3 months moving average

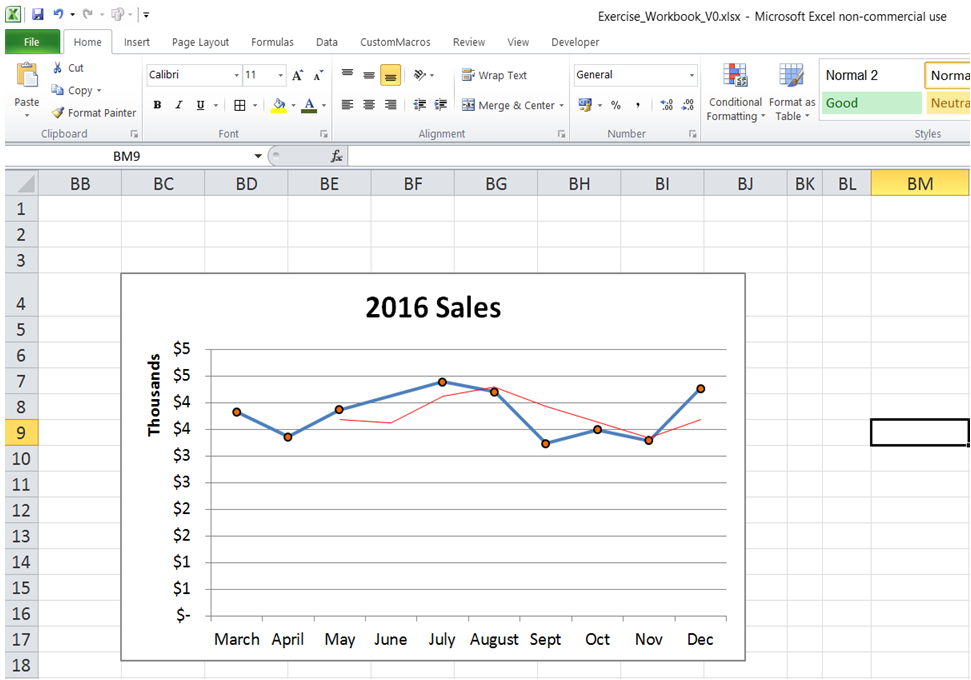
d) Three month Moving Average Trendline is now added to the chart as shown below.

excel add 3 months moving average


You can find similar Excel Questions and Answer hereunder

1) Every time I make an update to my Worksheet, I would like to add a timestamp to my Last Updated field. In Excel, how can I do that in Worksheet?

2) How can I add interval to dates?

3) How can I dynamically add series to an existing chart using VBA?

4) How can I add a WorkSheet and name it as required using VBA?

5) How can I add a legend to a chart using VBA?

6) How do I add a shape using VBA?

7) How can I add a Prefix to a set of numbers in a range?

8) How can I add a background image to a worksheet?

9) How do I enter a formula in a cell using VBA (using Relative Reference)?

10) I want to add a trend indicator symbol next to my sales data - how can I do that?


Here the previous and next chapter