Vba add trendline to chart in Excel
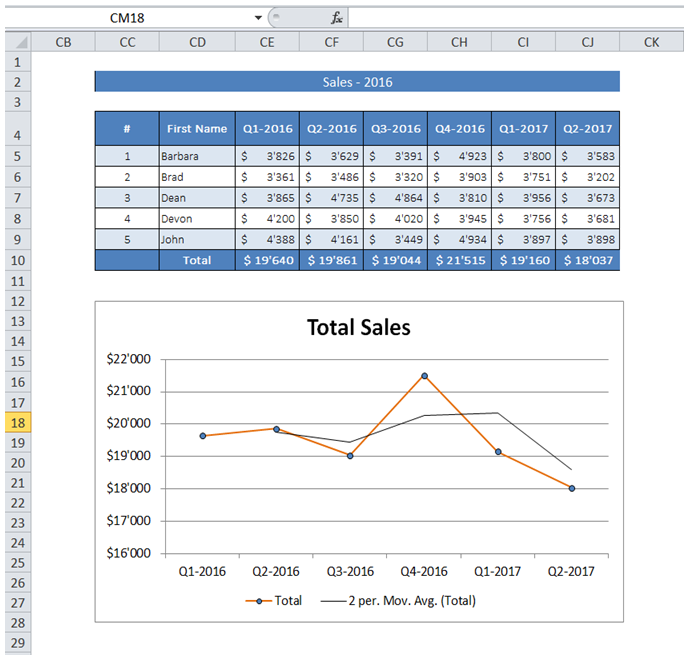
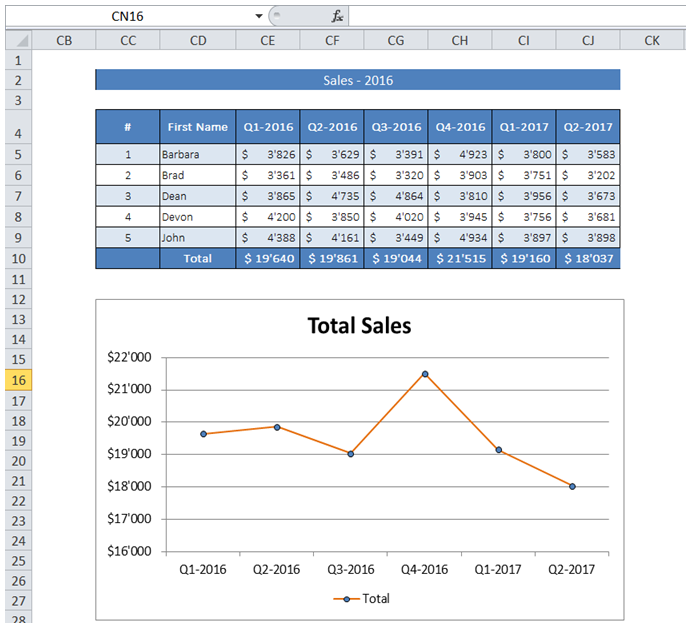
For example, I have a Chart ("Chart1") for Sales data of the last 6 quarters - I would like to get a 2-Quarters moving average trendline added to the chart.
To do it in Excel, here is the answer:
- Option Explicit
- Sub AddTrendLine()
- ActiveSheet.ChartObjects("Chart1").Chart.SeriesCollection(1).Trendlines.Add
- ActiveSheet.ChartObjects("Chart1").Chart.SeriesCollection(1).Trendlines(1).Select
- With Selection
- .Type = xlMovingAvg
- .Period = 2
- End With
- End Sub
Description:
a) Line 3 adds a Trendline to the Series Collection specified.
b) Line 6 specifies the Type of Trendline (could be xlExponential, xlLinear, xlLogarithmic,xlMovingAvg,xlPolynomial or xlPower)
c) Line 7 specifies the Peiod for moving average calculation.
Result after Macro execution: