VBA charts in VBA in Excel
In this session, we will see, how to use the chart with VBA. To have an overview of all possible charts in Excel please see the Excel Chart Tutorial
Two types of charts can be worked with in VBA.
1.Chart Sheet
2.Embedded Chart
A chart sheet is a separate sheet in your workbook, with its own tab.
An embedded chart is one which is inserted within a sheet.
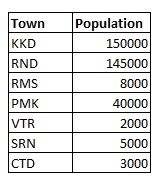
Let us consider the following data for illustration purpose.
Create a Chart sheet in VBA
The "Chart" object is used to create a new Chart sheet. The following code illustrates this:
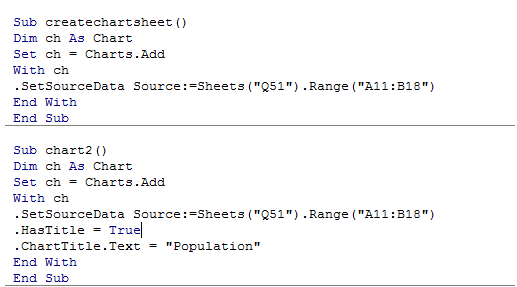
- Sub createchartsheet()
- Dim ch As Chart
- Set ch = Charts.Add
- With ch
- .SetSourceData Source:=Sheets("Q51").Range("A11:B18")
- End With
- End Sub
As seen from the above example, the chart object has various properties which can be used to define a meaningful chart.
The "SetSourceData" is used to specify the source range for the chart.
The "Chart" object has various other properties, some of which are as discussed below.
HasTitle
This property is used to set title of the chart.
Before specifying a title, this property has to be set true.
ChartTitle
This is used to specify the title of the chart after the "HasTitle" is enabled.
The following example illustrates this
- Sub chart2()
- Dim ch As Chart
- Set ch = Charts.Add
- With ch
- .SetSourceData Source:=Sheets("Q51").Range("A11:B18")
- .HasTitle = True
- .ChartTitle.Text = "Population"
- End With
- End Sub
Axes
Now, to set a label or title for X and Y axes, the "Axes" property is used.
This is illustrated as below
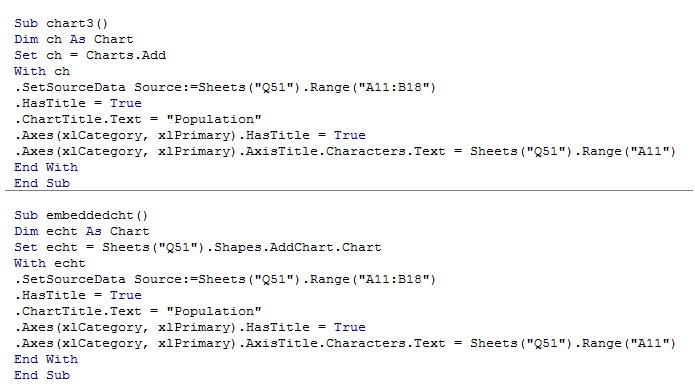
- Sub chart3()
- Dim ch As Chart
- Set ch = Charts.Add
- With ch
- .SetSourceData Source:=Sheets("Q51").Range("A11:B18")
- .HasTitle = True
- .ChartTitle.Text = "Population"
- .Axes(xlCategory, xlPrimary).HasTitle = True
- .Axes(xlCategory, xlPrimary).AxisTitle.Characters.Text = Sheets("Q51").Range("A11")
- End With
An Embedded chart is same as chart sheet, except that, they are created in the existing worksheet itself.
The following code demonstrates the embedded chart:
- Sub embeddedcht()
- Dim echt As Chart
- Set echt = Sheets("Q51").Shapes.AddChart.Chart
- With echt
- .SetSourceData Source:=Sheets("Q51").Range("A11:B18")
- .HasTitle = True
- .ChartTitle.Text = "Population"
- .Axes(xlCategory, xlPrimary).HasTitle = True
- .Axes(xlCategory, xlPrimary).AxisTitle.Characters.Text = Sheets("Q51").Range("A11")
- End With
- End Sub
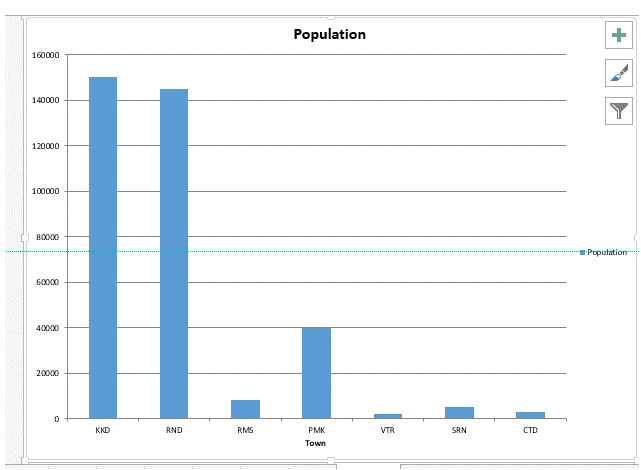
The screenshot of VBA Editor and outputs are as shown below:
Outputs: