Vba charts introduction, all the chart types in Excel
In Excel, a chart is a visual representation of data from a worksheet that gives a more detailed graph, rather than, simple text
A chart is sometimes called as a graph.
It is a powerful tool that enables the user to visually present the data with much more analytical details.
Charts are very often used with excel for data presentation.
For illustration purpose, let us have a sample data as give below:
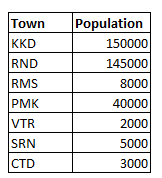
Now, with reference to the above data, the various chart types are discussed as below
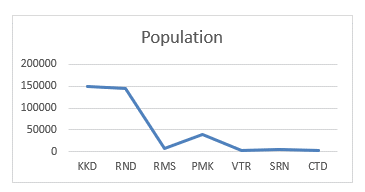
1.Line Chart
This chart is of linear type with x-axis and y-axis and the data are displayed as below
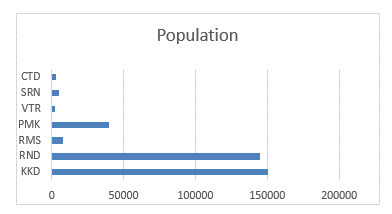
2.Bar Chart
The same data are presented in a Bar chart as shown below
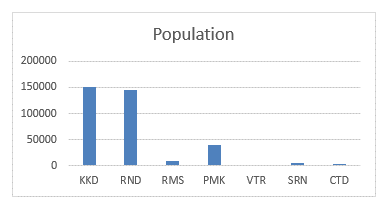
3.Column Chart
This chart presents the data as separate columns for each data.
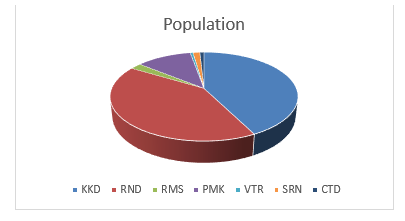
4.Pie Chart
This chart is more convinient in presenting large data and is the most commonly used chart.
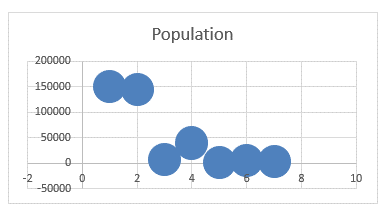
5.Bubble Chart
The Bubble chart for the same data is as shown below
It should be noted that, for every chart, there are multiple types, which can be chosen according to the need.