Vba dynamically add series to chart in Excel
For example, I already have a chart ("Chart1") of Sales data for Q1-2016. When Q2 Sales data becomes available how do I add it to an existing chart using VBA?
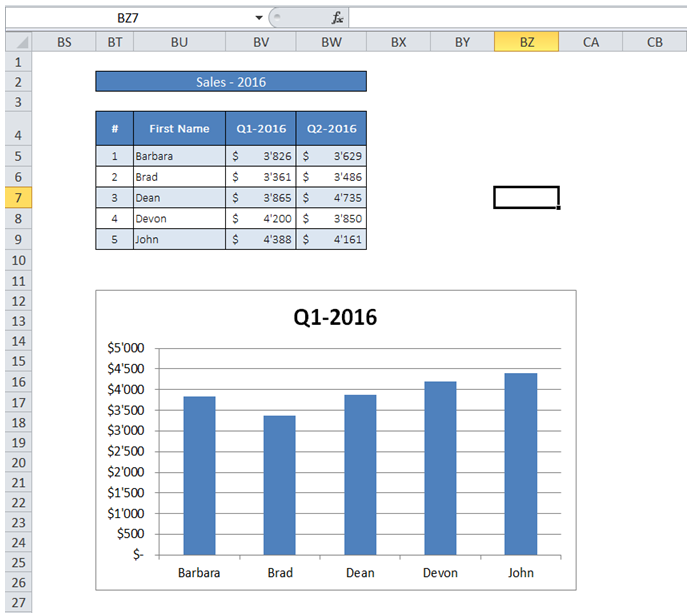
To do it in Excel, here is the answer:
- Option Explicit
- Sub AddChartSeries()
- With ActiveSheet.ChartObjects("Chart1").Chart.SeriesCollection.NewSeries
- .XValues = ActiveSheet.Range("BU5:BU9")
- .Values = ActiveSheet.Range("BW5:BW9")
- .Name = ActiveSheet.Range("BW4")
- End With
- End Sub
Description:
a) Line 3 - Adds a new series with range specified in "Line 4 for X-Axis Labels", "Line 5 for Y-Axis Values" and "Line 6 for Series Name".
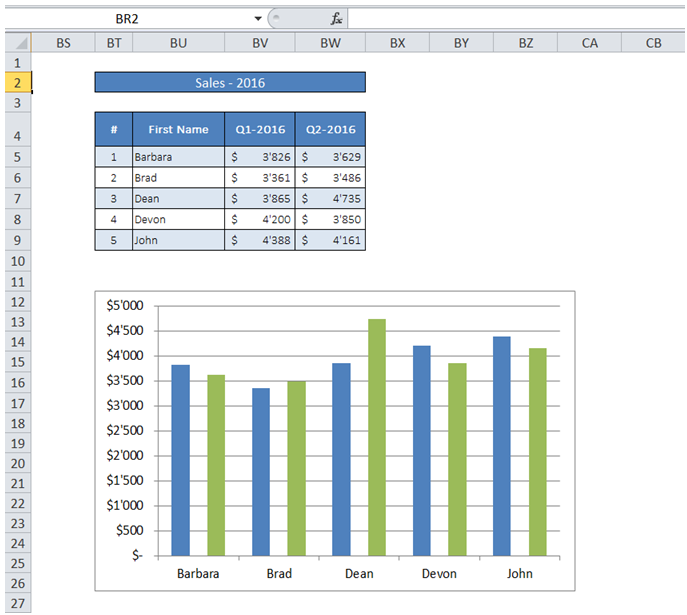
Result after Macro execution:
You can find similar Excel Questions and Answer hereunder
1) How can I find the number of working days between 2 dates using VBA?
2) How do I copy a Table from one location to another and retain all formulas, formats and columnwidths?
3) How can I change the Marker size and Marker line color for all the series in a chart?
4) How can I add and link a Chart Title to a cell value?
5) How can I export a WorkSheet as a PDF using VBA?
6) How can I set FreezePanes in a certain range using VBA?
7) How can I list all files in a folder using VBA?
8) How can I add a background image to a worksheet?
9) How can I shade alternate rows in color using VBA to make it easier to read voluminous data running into hundreds of rows?
10) How do I enter a formula in a cell using VBA (using Absolute Reference)?